


chiffres clés
Ouverture :
177.580 €
Perf Ouverture :
-2.20 %
+ Haut :
177.780 €
+ Bas :
173.340 €
Clôture veille :
178.180 €
Volume :
1 276 410
Capi échangé :
+0.20 %
Capi :
110 836 M€
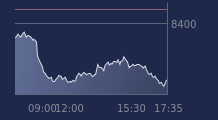
Graphique AIR LIQUIDE sur 5 jours
Cours AIR LIQUIDE sur 5 jours
| 02/07 | 03/07 | 06/07 | 07/07 | 08/07 | Date |
|---|---|---|---|---|---|
| 180.020(c) | 180.300(c) | 177.600(c) | 178.180(c) | 173.680(c) | Dernier |
| +2.11 % | +0.16 % | -1.50 % | +0.33 % | -2.53 % | Var. |
| 1 106 120 | 447 997 | 909 354 | 687 234 | 1 276 410 | Volume |
| 176.780 | 179.560 | 181.000 | 178.020 | 177.580 | Ouv. |
| 180.020 | 180.720 | 182.260 | 179.840 | 177.780 | + Haut |
| 176.580 | 178.860 | 176.820 | 177.340 | 173.340 | + Bas |
| 169.073 | 169.752 | 170.363 | 170.851 | 171.149 | MM20 |
| 165.680 | 165.870 | 165.997 | 166.149 | 166.321 | MM50 |
| 162.518 | 162.781 | 163.031 | 163.277 | 163.474 | MM100 |
Performances historiques AIR LIQUIDE
| 5 jours | 1 mois | 1er janvier | 5 ans |
|---|---|---|---|
| -1.49 % | +4.17 % | +19.21 % | +55.67 % |
Court terme
Haussière
Moyen terme
Haussière
Long terme
Haussière
Portefeuille Trading
+318.60 % vs +66.01 % pour le CAC 40
Performance depuis le 28 mai 2008