


chiffres clés
Ouverture :
7.215 €
Perf Ouverture :
-5.34 %
+ Haut :
7.225 €
+ Bas :
6.830 €
Clôture veille :
7.185 €
Volume :
211 670
Capi échangé :
+0.06 %
Capi :
2 619 M€
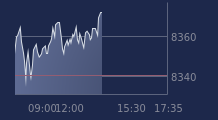
Graphique SES sur 5 jours
Cours SES sur 5 jours
| 18/06 | 19/06 | 22/06 | 23/06 | 24/06 | Date |
|---|---|---|---|---|---|
| 7.110(c) | 7.155(c) | 7.195(c) | 7.185(c) | 6.830 | Dernier |
| -4.31 % | +0.63 % | +0.56 % | -0.14 % | -4.94 % | Var. |
| 1 011 570 | 3 775 320 | 932 275 | 1 434 740 | 211 670 | Volume |
| 7.540 | 7.130 | 7.145 | 7.115 | 7.215 | Ouv. |
| 7.540 | 7.205 | 7.195 | 7.425 | 7.225 | + Haut |
| 7.050 | 6.935 | 6.910 | 6.920 | 6.830 | + Bas |
| 8.485 | 8.395 | 8.310 | 8.204 | 8.075 | MM20 |
| 7.667 | 7.683 | 7.698 | 7.713 | 7.725 | MM50 |
| 7.042 | 7.050 | 7.053 | 7.056 | 7.055 | MM100 |
Performances historiques SES
| 5 jours | 1 mois | 1er janvier | 5 ans |
|---|---|---|---|
| -8.08 % | -23.69 % | +23.51 % | +8.97 % |
Court terme
Baissière
Moyen terme
Neutre
Long terme
Haussière
Portefeuille Trading
+321.80 % vs +68.38 % pour le CAC 40
Performance depuis le 28 mai 2008