


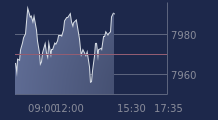
chiffres clés
Ouverture :
1.813 €
Perf Ouverture :
-1.05 %
+ Haut :
1.813 €
+ Bas :
1.751 €
Clôture veille :
1.820 €
Volume :
584 968
Capi échangé :
+0.19 %
Capi :
564 M€
Graphique DBV TECHNOLOGIES sur 5 jours
Cours DBV TECHNOLOGIES sur 5 jours
| 26/10 | 27/10 | 28/10 | 29/10 | 30/10 | Date |
|---|---|---|---|---|---|
| 1.792(c) | 1.850(c) | 1.906(c) | 1.820(c) | 1.775 | Dernier |
| +4.31 % | +3.24 % | +3.03 % | -4.51 % | -2.47 % | Var. |
| 985 485 | 1 117 030 | 1 125 330 | 4 490 470 | 569 567 | Volume |
| 1.732 | 1.794 | 1.851 | 1.736 | 1.813 | Ouv. |
| 1.841 | 1.883 | 1.917 | 1.909 | 1.813 | + Haut |
| 1.732 | 1.784 | 1.810 | 1.651 | 1.751 | + Bas |
| 1.758 | 1.750 | 1.741 | 1.734 | 1.728 | MM20 |
| 2.077 | 2.063 | 2.051 | 2.037 | 2.023 | MM50 |
| 2.369 | 2.360 | 2.352 | 2.342 | 2.329 | MM100 |
Performances historiques DBV TECHNOLOGIES
| 5 jours | 1 mois | 1er janvier | 5 ans |
|---|---|---|---|
| +4.42 % | -11.10 % | -46.92 % | -68.83 % |
Court terme
Neutre
Moyen terme
Baissière
Long terme
Baissière
Portefeuille Trading
+317.20 % vs +60.66 % pour le CAC 40
Performance depuis le 28 mai 2008