


chiffres clés
Ouverture :
41.300 €
Perf Ouverture :
-3.39 %
+ Haut :
41.300 €
+ Bas :
39.800 €
Clôture veille :
41.000 €
Volume :
11 821
Capi échangé :
+0.05 %
Capi :
994 M€
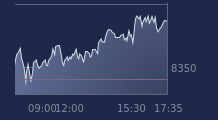
Graphique WAVESTONE sur 5 jours
Cours WAVESTONE sur 5 jours
| 19/06 | 22/06 | 23/06 | 24/06 | 25/06 | Date |
|---|---|---|---|---|---|
| 39.750(c) | 40.900(c) | 41.000(c) | 39.900(c) | - | Dernier |
| -0.75 % | +2.89 % | +0.24 % | -2.68 % | - | Var. |
| 16 548 | 12 553 | 35 666 | 11 821 | - | Volume |
| 40.000 | 40.000 | 40.400 | 41.300 | - | Ouv. |
| 40.100 | 41.200 | 41.500 | 41.300 | - | + Haut |
| 39.450 | 39.400 | 40.350 | 39.800 | - | + Bas |
| 43.980 | 43.745 | 43.543 | 43.238 | - | MM20 |
| 45.044 | 44.931 | 44.811 | 44.654 | - | MM50 |
| 46.944 | 46.735 | 46.555 | 46.351 | - | MM100 |
Performances historiques WAVESTONE
| 5 jours | 1 mois | 1er janvier | 5 ans |
|---|---|---|---|
| -3.97 % | -11.73 % | -28.24 % | -0.75 % |
Court terme
Baissière
Moyen terme
Baissière
Long terme
Baissière
Portefeuille Trading
+322.00 % vs +68.68 % pour le CAC 40
Performance depuis le 28 mai 2008