


chiffres clés
Ouverture :
5.270 €
Perf Ouverture :
-4.10 %
+ Haut :
5.320 €
+ Bas :
5.004 €
Clôture veille :
5.276 €
Volume :
401 467
Capi échangé :
+0.30 %
Capi :
687 M€
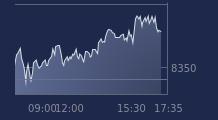
Graphique UBISOFT ENTERTAIN sur 5 jours
Cours UBISOFT ENTERTAIN sur 5 jours
| 18/06 | 19/06 | 22/06 | 23/06 | 24/06 | Date |
|---|---|---|---|---|---|
| 5.070(c) | 5.260(c) | 5.156(c) | 5.276(c) | 5.054 | Dernier |
| +0.36 % | +3.75 % | -1.98 % | +2.33 % | -4.21 % | Var. |
| 1 322 760 | 1 273 240 | 554 796 | 713 040 | 401 267 | Volume |
| 4.974 | 5.100 | 5.276 | 5.150 | 5.270 | Ouv. |
| 5.176 | 5.360 | 5.306 | 5.362 | 5.320 | + Haut |
| 4.750 | 5.100 | 5.156 | 5.080 | 5.004 | + Bas |
| 5.162 | 5.161 | 5.155 | 5.154 | 5.141 | MM20 |
| 4.983 | 5.009 | 5.032 | 5.054 | 5.064 | MM50 |
| 4.549 | 4.559 | 4.566 | 4.572 | 4.579 | MM100 |
Performances historiques UBISOFT ENTERTAIN
| 5 jours | 1 mois | 1er janvier | 5 ans |
|---|---|---|---|
| +0.04 % | -4.35 % | -21.55 % | -91.32 % |
Court terme
Neutre
Moyen terme
Neutre
Long terme
Haussière
Portefeuille Trading
+321.80 % vs +68.52 % pour le CAC 40
Performance depuis le 28 mai 2008