


chiffres clés
Ouverture :
20.500 €
Perf Ouverture :
-2.20 %
+ Haut :
20.500 €
+ Bas :
19.740 €
Clôture veille :
20.400 €
Volume :
15 421
Capi échangé :
+0.04 %
Capi :
795 M€
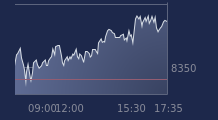
Graphique MANITOU BF sur 5 jours
Cours MANITOU BF sur 5 jours
| 19/06 | 22/06 | 23/06 | 24/06 | 25/06 | Date |
|---|---|---|---|---|---|
| 21.250(c) | 20.750(c) | 20.400(c) | 20.050(c) | - | Dernier |
| +0.71 % | -2.35 % | -1.69 % | -1.72 % | - | Var. |
| 14 431 | 27 641 | 11 960 | 15 421 | - | Volume |
| 21.050 | 21.300 | 20.700 | 20.500 | - | Ouv. |
| 21.300 | 21.500 | 20.700 | 20.500 | - | + Haut |
| 21.000 | 20.400 | 20.200 | 19.740 | - | + Bas |
| 21.168 | 21.155 | 21.113 | 21.055 | - | MM20 |
| 21.207 | 21.193 | 21.183 | 21.148 | - | MM50 |
| 21.133 | 21.160 | 21.150 | 21.128 | - | MM100 |
Performances historiques MANITOU BF
| 5 jours | 1 mois | 1er janvier | 5 ans |
|---|---|---|---|
| -5.20 % | -3.61 % | +3.89 % | -26.29 % |
Court terme
Baissière
Moyen terme
Baissière
Long terme
Baissière
Portefeuille Trading
+322.00 % vs +68.68 % pour le CAC 40
Performance depuis le 28 mai 2008