


chiffres clés
Ouverture :
151.600 €
Perf Ouverture :
-2.18 %
+ Haut :
151.900 €
+ Bas :
147.600 €
Clôture veille :
151.200 €
Volume :
17 554
Capi échangé :
+0.04 %
Capi :
6 488 M€
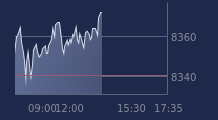
Graphique NEXANS sur 5 jours
Cours NEXANS sur 5 jours
| 18/06 | 19/06 | 22/06 | 23/06 | 24/06 | Date |
|---|---|---|---|---|---|
| 154.400(c) | 158.800(c) | 159.000(c) | 151.200(c) | 148.400 | Dernier |
| +0.85 % | +2.85 % | +0.13 % | -4.91 % | -1.85 % | Var. |
| 108 607 | 227 105 | 133 178 | 123 682 | 17 545 | Volume |
| 153.400 | 155.300 | 158.800 | 155.700 | 151.600 | Ouv. |
| 155.300 | 164.300 | 160.300 | 156.600 | 151.900 | + Haut |
| 150.600 | 155.300 | 157.400 | 150.600 | 147.600 | + Bas |
| 155.100 | 154.970 | 154.820 | 154.300 | 153.670 | MM20 |
| 151.524 | 152.124 | 152.682 | 153.114 | 153.416 | MM50 |
| 138.359 | 138.650 | 138.932 | 139.131 | 139.286 | MM100 |
Performances historiques NEXANS
| 5 jours | 1 mois | 1er janvier | 5 ans |
|---|---|---|---|
| -3.14 % | -8.12 % | +17.89 % | +106.26 % |
Court terme
Neutre
Moyen terme
Neutre
Long terme
Haussière
Portefeuille Trading
+321.80 % vs +68.38 % pour le CAC 40
Performance depuis le 28 mai 2008