


chiffres clés
Ouverture :
70.900 €
Perf Ouverture :
-1.16 %
+ Haut :
70.960 €
+ Bas :
70.030 €
Clôture veille :
70.810 €
Volume :
612 504
Capi échangé :
+0.03 %
Capi :
159 510 M€
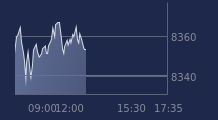
Graphique TOTALENERGIES sur 5 jours
Cours TOTALENERGIES sur 5 jours
| 18/06 | 19/06 | 22/06 | 23/06 | 24/06 | Date |
|---|---|---|---|---|---|
| 70.340(c) | 71.070(c) | 70.920(c) | 70.810(c) | 70.080 | Dernier |
| -2.59 % | +1.04 % | -0.21 % | -0.16 % | -1.03 % | Var. |
| 7 855 070 | 15 195 900 | 4 981 320 | 4 444 390 | 612 504 | Volume |
| 71.850 | 71.190 | 71.380 | 71.400 | 70.900 | Ouv. |
| 72.160 | 71.670 | 71.600 | 71.520 | 70.960 | + Haut |
| 70.170 | 70.740 | 70.250 | 70.370 | 70.030 | + Bas |
| 75.998 | 75.619 | 75.281 | 74.911 | 74.644 | MM20 |
| 76.974 | 76.818 | 76.664 | 76.487 | 76.341 | MM50 |
| 73.083 | 73.200 | 73.309 | 73.409 | 73.499 | MM100 |
Performances historiques TOTALENERGIES
| 5 jours | 1 mois | 1er janvier | 5 ans |
|---|---|---|---|
| -2.95 % | -10.90 % | +26.07 % | +75.02 % |
Court terme
Baissière
Moyen terme
Baissière
Long terme
Neutre
Portefeuille Trading
+321.80 % vs +68.26 % pour le CAC 40
Performance depuis le 28 mai 2008