


chiffres clés
Ouverture :
51.900 €
Perf Ouverture :
+0.19 %
+ Haut :
52.000 €
+ Bas :
51.100 €
Clôture veille :
52.150 €
Volume :
70 483
Capi échangé :
+0.05 %
Capi :
7 668 M€
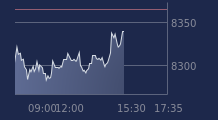
Graphique SODEXO sur 5 jours
Cours SODEXO sur 5 jours
| 08/07 | 09/07 | 10/07 | 13/07 | 14/07 | Date |
|---|---|---|---|---|---|
| 54.100(c) | 53.800(c) | 52.950(c) | 52.150(c) | 52.000 | Dernier |
| +1.31 % | -0.55 % | -1.58 % | -1.51 % | -0.29 % | Var. |
| 302 970 | 261 027 | 301 421 | 336 035 | 70 483 | Volume |
| 53.600 | 53.950 | 54.000 | 52.700 | 51.900 | Ouv. |
| 54.200 | 54.250 | 54.100 | 53.100 | 52.000 | + Haut |
| 53.350 | 53.450 | 52.650 | 52.150 | 51.100 | + Bas |
| 51.211 | 51.469 | 51.597 | 51.687 | 51.762 | MM20 |
| 48.193 | 48.414 | 48.607 | 48.779 | 48.951 | MM50 |
| 46.119 | 46.189 | 46.247 | 46.297 | 46.342 | MM100 |
Performances historiques SODEXO
| 5 jours | 1 mois | 1er janvier | 5 ans |
|---|---|---|---|
| -2.62 % | +3.17 % | +18.99 % | -6.51 % |
Court terme
Haussière
Moyen terme
Haussière
Long terme
Haussière
Portefeuille Trading
+320.20 % vs +67.85 % pour le CAC 40
Performance depuis le 28 mai 2008