


chiffres clés
Ouverture :
57.150 €
Perf Ouverture :
+0.70 %
+ Haut :
58.200 €
+ Bas :
56.700 €
Clôture veille :
57.200 €
Volume :
240 774
Capi échangé :
+0.32 %
Capi :
4 377 M€
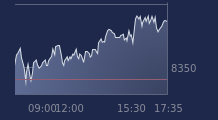
Graphique ARKEMA sur 5 jours
Cours ARKEMA sur 5 jours
| 19/06 | 22/06 | 23/06 | 24/06 | 25/06 | Date |
|---|---|---|---|---|---|
| 58.100(c) | 57.900(c) | 57.200(c) | 57.550(c) | - | Dernier |
| +0.87 % | -0.34 % | -1.21 % | +0.61 % | - | Var. |
| 265 433 | 154 264 | 257 253 | 240 774 | - | Volume |
| 57.300 | 58.000 | 57.800 | 57.150 | - | Ouv. |
| 58.100 | 58.300 | 58.050 | 58.200 | - | + Haut |
| 57.050 | 56.850 | 56.700 | 56.700 | - | + Bas |
| 59.213 | 59.148 | 59.040 | 58.935 | - | MM20 |
| 60.903 | 60.829 | 60.756 | 60.699 | - | MM50 |
| 59.118 | 59.184 | 59.242 | 59.309 | - | MM100 |
Performances historiques ARKEMA
| 5 jours | 1 mois | 1er janvier | 5 ans |
|---|---|---|---|
| -2.87 % | -7.48 % | +10.35 % | -45.81 % |
Court terme
Neutre
Moyen terme
Baissière
Long terme
Neutre
Portefeuille Trading
+322.00 % vs +68.68 % pour le CAC 40
Performance depuis le 28 mai 2008