


chiffres clés
Ouverture :
168.200 €
Perf Ouverture :
+1.19 %
+ Haut :
170.200 €
+ Bas :
166.400 €
Clôture veille :
169.200 €
Volume :
5 875
Capi échangé :
+0.01 %
Capi :
16 566 M€
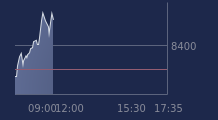
Graphique SARTORIUS STED BIO sur 5 jours
Cours SARTORIUS STED BIO sur 5 jours
| 19/06 | 22/06 | 23/06 | 24/06 | 25/06 | Date |
|---|---|---|---|---|---|
| 163.300(c) | 161.900(c) | 163.200(c) | 169.200(c) | 170.200 | Dernier |
| -1.33 % | -0.86 % | +0.80 % | +3.68 % | +0.59 % | Var. |
| 134 421 | 67 847 | 92 351 | 84 310 | 5 875 | Volume |
| 165.300 | 164.400 | 161.300 | 164.000 | 168.200 | Ouv. |
| 165.800 | 167.300 | 165.700 | 170.400 | 170.200 | + Haut |
| 161.500 | 160.400 | 161.300 | 163.000 | 166.400 | + Bas |
| 175.385 | 174.825 | 174.400 | 174.300 | 174.075 | MM20 |
| 170.678 | 170.510 | 170.296 | 170.064 | 169.794 | MM50 |
| 172.084 | 171.728 | 171.445 | 171.254 | 171.084 | MM100 |
Performances historiques SARTORIUS STED BIO
| 5 jours | 1 mois | 1er janvier | 5 ans |
|---|---|---|---|
| +2.84 % | -0.29 % | -18.95 % | -56.12 % |
Court terme
Baissière
Moyen terme
Baissière
Long terme
Baissière
Pas de conseil sur cette valeur
Portefeuille Trading
+322.00 % vs +69.38 % pour le CAC 40
Performance depuis le 28 mai 2008