


chiffres clés
Ouverture :
6.100 €
Perf Ouverture :
+2.46 %
+ Haut :
6.250 €
+ Bas :
5.600 €
Clôture veille :
6.200 €
Volume :
2 340
Capi échangé :
+0.17 %
Capi :
9 M€
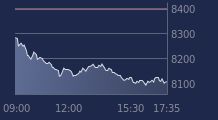
Graphique PRISMAFLEX INTL sur 5 jours
Cours PRISMAFLEX INTL sur 5 jours
| 26/02 | 27/02 | 02/03 | 03/03 | 04/03 | Date |
|---|---|---|---|---|---|
| 6.900(c) | 6.900(c) | 6.200(c) | 6.250(c) | - | Dernier |
| 0.00 % | 0.00 % | -10.14 % | +0.81 % | - | Var. |
| 4 | 15 | 2 569 | 2 340 | - | Volume |
| 6.850 | 6.850 | 6.850 | 6.100 | - | Ouv. |
| 6.900 | 6.900 | 6.900 | 6.250 | - | + Haut |
| 6.850 | 6.850 | 6.200 | 5.600 | - | + Bas |
| 6.995 | 7.010 | 6.960 | 6.913 | - | MM20 |
| 7.164 | 7.144 | 7.114 | 7.086 | - | MM50 |
| 8.208 | 8.160 | 8.107 | 8.055 | - | MM100 |
Performances historiques PRISMAFLEX INTL
| 5 jours | 1 mois | 1er janvier | 5 ans |
|---|---|---|---|
| -9.42 % | -13.19 % | -13.19 % | -6.16 % |
Court terme
Baissière
Moyen terme
Baissière
Long terme
Baissière
Pas de conseil sur cette valeur
Portefeuille Trading
+332.40 % vs +63.02 % pour le CAC 40
Performance depuis le 28 mai 2008