


chiffres clés
Ouverture :
13.120 €
Perf Ouverture :
-2.44 %
+ Haut :
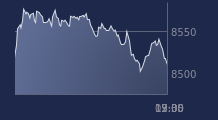
13.340 €
+ Bas :
12.800 €
Clôture veille :
13.070 €
Volume :
88 991
Capi échangé :
+0.06 %
Capi :
1 843 M€
Graphique OPMOBILITY (EX-PLASTIC OMNIUM) sur 5 jours
Cours OPMOBILITY (EX-PLASTIC OMNIUM) sur 5 jours
| 27/07 | 28/07 | 29/07 | 30/07 | 31/07 | Date |
|---|---|---|---|---|---|
| 12.740(c) | 12.830(c) | 12.750(c) | 13.070(c) | 12.800(c) | Dernier |
| +0.08 % | +0.71 % | -0.62 % | +2.51 % | -2.07 % | Var. |
| 103 259 | 102 979 | 118 914 | 97 815 | 88 991 | Volume |
| 12.960 | 12.860 | 12.860 | 12.750 | 13.120 | Ouv. |
| 12.980 | 12.960 | 13.080 | 13.200 | 13.340 | + Haut |
| 12.670 | 12.720 | 12.720 | 12.700 | 12.800 | + Bas |
| 13.336 | 13.295 | 13.253 | 13.223 | 13.172 | MM20 |
| 14.462 | 14.416 | 14.373 | 14.335 | 14.285 | MM50 |
| 14.816 | 14.791 | 14.768 | 14.750 | 14.724 | MM100 |
Performances historiques OPMOBILITY (EX-PLASTIC OMNIUM)
| 5 jours | 1 mois | 1er janvier | 5 ans |
|---|---|---|---|
| +0.55 % | -4.62 % | -19.85 % | -52.17 % |
Court terme
Baissière
Moyen terme
Baissière
Long terme
Baissière
Portefeuille Trading
+321.90 % vs +71.18 % pour le CAC 40
Performance depuis le 28 mai 2008