


chiffres clés
Ouverture :
7.770 €
Perf Ouverture :
+0.90 %
+ Haut :
7.850 €
+ Bas :
7.725 €
Clôture veille :
7.825 €
Volume :
68 601
Capi échangé :
+0.12 %
Capi :
440 M€
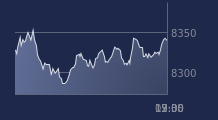
Graphique NEXITY sur 5 jours
Cours NEXITY sur 5 jours
| 13/07 | 14/07 | 15/07 | 16/07 | 17/07 | Date |
|---|---|---|---|---|---|
| 7.540(c) | 7.660(c) | 7.835(c) | 7.825(c) | 7.840(c) | Dernier |
| -0.46 % | +1.59 % | +2.28 % | -0.13 % | +0.19 % | Var. |
| 105 016 | 116 413 | 115 623 | 48 035 | 68 601 | Volume |
| 7.550 | 7.490 | 7.645 | 7.790 | 7.770 | Ouv. |
| 7.675 | 7.725 | 7.870 | 7.855 | 7.850 | + Haut |
| 7.505 | 7.440 | 7.530 | 7.745 | 7.725 | + Bas |
| 7.856 | 7.851 | 7.853 | 7.851 | 7.847 | MM20 |
| 8.056 | 8.041 | 8.021 | 7.999 | 7.981 | MM50 |
| 8.249 | 8.237 | 8.226 | 8.214 | 8.203 | MM100 |
Performances historiques NEXITY
| 5 jours | 1 mois | 1er janvier | 5 ans |
|---|---|---|---|
| +3.50 % | +1.23 % | -12.65 % | -81.55 % |
Court terme
Baissière
Moyen terme
Baissière
Long terme
Baissière
Portefeuille Trading
+318.20 % vs +67.75 % pour le CAC 40
Performance depuis le 28 mai 2008