


chiffres clés
Ouverture :
119.000 €
Perf Ouverture :
+1.51 %
+ Haut :
120.800 €
+ Bas :
119.000 €
Clôture veille :
119.000 €
Volume :
401
Capi échangé :
+0.00 %
Capi :
1 552 M€
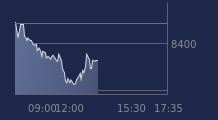
Graphique STEF sur 5 jours
Cours STEF sur 5 jours
| 16/06 | 17/06 | 18/06 | 19/06 | 22/06 | Date |
|---|---|---|---|---|---|
| 118.600(c) | 118.800(c) | 116.600(c) | 119.000(c) | 120.800 | Dernier |
| -3.89 % | +0.17 % | -1.85 % | +2.06 % | +1.51 % | Var. |
| 2 592 | 1 340 | 4 010 | 5 051 | 401 | Volume |
| 123.800 | 120.400 | 119.000 | 119.000 | 119.000 | Ouv. |
| 124.400 | 120.600 | 119.000 | 120.600 | 120.800 | + Haut |
| 118.600 | 117.600 | 116.600 | 116.600 | 119.000 | + Bas |
| 118.150 | 118.250 | 118.210 | 118.330 | 118.490 | MM20 |
| 117.960 | 117.980 | 117.872 | 117.816 | 117.792 | MM50 |
| 120.086 | 120.012 | 119.916 | 119.836 | 119.784 | MM100 |
Performances historiques STEF
| 5 jours | 1 mois | 1er janvier | 5 ans |
|---|---|---|---|
| -2.11 % | +2.90 % | -8.07 % | +32.46 % |
Court terme
Neutre
Moyen terme
Neutre
Long terme
Baissière
Portefeuille Trading
+324.10 % vs +68.64 % pour le CAC 40
Performance depuis le 28 mai 2008