


chiffres clés
Ouverture :
16.860 €
Perf Ouverture :
+0.27 %
+ Haut :
17.020 €
+ Bas :
16.840 €
Clôture veille :
16.905 €
Volume :
626 184
Capi échangé :
+0.02 %
Capi :
44 968 M€
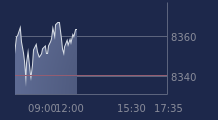
Graphique ORANGE sur 5 jours
Cours ORANGE sur 5 jours
| 18/06 | 19/06 | 22/06 | 23/06 | 24/06 | Date |
|---|---|---|---|---|---|
| 17.005(c) | 17.085(c) | 16.865(c) | 16.905(c) | 16.905 | Dernier |
| +0.41 % | +0.47 % | -1.29 % | +0.24 % | 0.00 % | Var. |
| 4 540 400 | 12 421 100 | 6 449 060 | 3 905 320 | 626 184 | Volume |
| 16.985 | 17.070 | 17.085 | 17.005 | 16.860 | Ouv. |
| 17.110 | 17.085 | 17.130 | 17.115 | 17.020 | + Haut |
| 16.825 | 16.865 | 16.655 | 16.880 | 16.840 | + Bas |
| 17.738 | 17.682 | 17.619 | 17.564 | 17.501 | MM20 |
| 17.857 | 17.837 | 17.816 | 17.801 | 17.783 | MM50 |
| 17.523 | 17.539 | 17.551 | 17.565 | 17.577 | MM100 |
Performances historiques ORANGE
| 5 jours | 1 mois | 1er janvier | 5 ans |
|---|---|---|---|
| -0.18 % | -7.14 % | +19.05 % | +75.05 % |
Court terme
Baissière
Moyen terme
Baissière
Long terme
Neutre
Portefeuille Trading
+321.80 % vs +68.17 % pour le CAC 40
Performance depuis le 28 mai 2008