


chiffres clés
Ouverture :
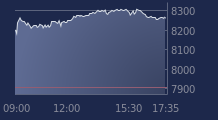
184.500 €
Perf Ouverture :
-0.57 %
+ Haut :
184.580 €
+ Bas :
180.920 €
Clôture veille :
181.500 €
Volume :
1 591 660
Capi échangé :
+0.27 %
Capi :
106 281 M€
Graphique AIR LIQUIDE sur 5 jours
Cours AIR LIQUIDE sur 5 jours
| 01/04 | 02/04 | 07/04 | 08/04 | 09/04 | Date |
|---|---|---|---|---|---|
| 180.000(c) | 180.520(c) | 181.500(c) | 183.440(c) | - | Dernier |
| +1.17 % | +0.29 % | +0.54 % | +1.07 % | - | Var. |
| 1 087 660 | 819 628 | 933 085 | 1 591 660 | - | Volume |
| 177.920 | 178.140 | 181.000 | 184.500 | - | Ouv. |
| 180.060 | 181.320 | 183.080 | 184.580 | - | + Haut |
| 177.600 | 177.700 | 180.720 | 180.920 | - | + Bas |
| 170.714 | 171.225 | 171.935 | 172.838 | - | MM20 |
| 168.847 | 169.313 | 169.791 | 170.312 | - | MM50 |
| 165.417 | 165.524 | 165.623 | 165.735 | - | MM100 |
Performances historiques AIR LIQUIDE
| 5 jours | 1 mois | 1er janvier | 5 ans |
|---|---|---|---|
| +1.91 % | +9.65 % | +14.46 % | +58.86 % |
Court terme
Haussière
Moyen terme
Haussière
Long terme
Haussière
Portefeuille Trading
+331.90 % vs +66.24 % pour le CAC 40
Performance depuis le 28 mai 2008