


chiffres clés
Ouverture :
37.260 €
Perf Ouverture :
-0.21 %
+ Haut :
38.640 €
+ Bas :
36.900 €
Clôture veille :
37.940 €
Volume :
29 206
Capi échangé :
+0.10 %
Capi :
1 069 M€
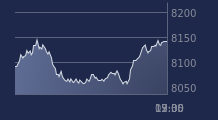
Graphique ERAMET sur 5 jours
Cours ERAMET sur 5 jours
| 02/11 | 03/11 | 04/11 | 05/11 | 06/11 | Date |
|---|---|---|---|---|---|
| 38.280(c) | 37.880(c) | 38.700(c) | 37.940(c) | 37.180(c) | Dernier |
| -0.26 % | -1.04 % | +2.16 % | -1.96 % | -2.00 % | Var. |
| 23 783 | 25 048 | 30 665 | 28 695 | 29 206 | Volume |
| 38.200 | 37.820 | 38.200 | 38.520 | 37.260 | Ouv. |
| 38.600 | 39.120 | 39.820 | 39.620 | 38.640 | + Haut |
| 36.980 | 37.260 | 38.080 | 37.180 | 36.900 | + Bas |
| 38.411 | 38.022 | 37.688 | 37.315 | 36.908 | MM20 |
| 42.159 | 41.992 | 41.870 | 41.726 | 41.561 | MM50 |
| 43.912 | 43.770 | 43.620 | 43.486 | 43.352 | MM100 |
Performances historiques ERAMET
| 5 jours | 1 mois | 1er janvier | 5 ans |
|---|---|---|---|
| -3.13 % | -17.19 % | -35.51 % | -45.32 % |
Court terme
Neutre
Moyen terme
Baissière
Long terme
Baissière
Portefeuille Trading
+316.60 % vs +63.73 % pour le CAC 40
Performance depuis le 28 mai 2008