


chiffres clés
Ouverture :
15.980 €
Perf Ouverture :
+0.94 %
+ Haut :
16.130 €
+ Bas :
15.940 €
Clôture veille :
16.050 €
Volume :
139 461
Capi échangé :
+0.09 %
Capi :
2 422 M€
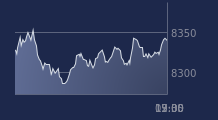
Graphique COFACE sur 5 jours
Cours COFACE sur 5 jours
| 13/07 | 14/07 | 15/07 | 16/07 | 17/07 | Date |
|---|---|---|---|---|---|
| 15.770(c) | 16.030(c) | 16.010(c) | 16.050(c) | 16.130(c) | Dernier |
| +0.45 % | +1.65 % | -0.12 % | +0.25 % | +0.50 % | Var. |
| 168 507 | 215 814 | 307 161 | 147 564 | 139 461 | Volume |
| 15.760 | 15.740 | 15.990 | 15.970 | 15.980 | Ouv. |
| 15.780 | 16.050 | 16.390 | 16.050 | 16.130 | + Haut |
| 15.650 | 15.650 | 15.680 | 15.810 | 15.940 | + Bas |
| 15.272 | 15.300 | 15.333 | 15.374 | 15.420 | MM20 |
| 15.444 | 15.452 | 15.449 | 15.447 | 15.449 | MM50 |
| 15.392 | 15.390 | 15.394 | 15.397 | 15.404 | MM100 |
Performances historiques COFACE
| 5 jours | 1 mois | 1er janvier | 5 ans |
|---|---|---|---|
| +2.74 % | +4.27 % | +2.74 % | +55.10 % |
Court terme
Haussière
Moyen terme
Haussière
Long terme
Haussière
Portefeuille Trading
+318.20 % vs +67.75 % pour le CAC 40
Performance depuis le 28 mai 2008