


chiffres clés
Ouverture :
78.500 €
Perf Ouverture :
+2.17 %
+ Haut :
82.000 €
+ Bas :
78.500 €
Clôture veille :
77.700 €
Volume :
2 783
Capi échangé :
+0.02 %
Capi :
953 M€
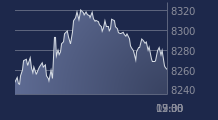
Graphique VETOQUINOL sur 5 jours
Cours VETOQUINOL sur 5 jours
| 02/04 | 07/04 | 08/04 | 09/04 | 10/04 | Date |
|---|---|---|---|---|---|
| 78.400(c) | 77.000(c) | 78.600(c) | 77.700(c) | 80.200(c) | Dernier |
| +0.13 % | -1.79 % | +2.08 % | -1.15 % | +3.22 % | Var. |
| 2 517 | 3 496 | 3 144 | 2 245 | 2 783 | Volume |
| 78.300 | 79.200 | 79.800 | 78.900 | 78.500 | Ouv. |
| 78.400 | 79.900 | 79.800 | 78.900 | 82.000 | + Haut |
| 76.700 | 77.000 | 78.300 | 77.000 | 78.500 | + Bas |
| 78.780 | 78.705 | 78.655 | 78.485 | 78.505 | MM20 |
| 82.952 | 82.804 | 82.678 | 82.514 | 82.414 | MM50 |
| 80.787 | 80.836 | 80.890 | 80.938 | 81.017 | MM100 |
Performances historiques VETOQUINOL
| 5 jours | 1 mois | 1er janvier | 5 ans |
|---|---|---|---|
| +2.30 % | +0.75 % | -3.95 % | -19.72 % |
Court terme
Haussière
Moyen terme
Neutre
Long terme
Neutre
Portefeuille Trading
+332.70 % vs +66.15 % pour le CAC 40
Performance depuis le 28 mai 2008