


chiffres clés
Ouverture :
181.200 €
Perf Ouverture :
-0.28 %
+ Haut :
185.000 €
+ Bas :
180.500 €
Clôture veille :
179.350 €
Volume :
14 441
Capi échangé :
+0.01 %
Capi :
17 588 M€
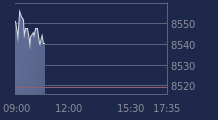
Graphique SARTORIUS STED BIO sur 5 jours
Cours SARTORIUS STED BIO sur 5 jours
| 19/02 | 20/02 | 23/02 | 24/02 | 25/02 | Date |
|---|---|---|---|---|---|
| 175.950(c) | 182.750(c) | 176.700(c) | 179.350(c) | 180.700 | Dernier |
| +0.49 % | +3.86 % | -3.31 % | +1.50 % | +0.75 % | Var. |
| 101 046 | 137 578 | 90 470 | 123 289 | 14 441 | Volume |
| 175.200 | 177.950 | 181.500 | 176.000 | 181.200 | Ouv. |
| 177.000 | 184.200 | 181.500 | 180.650 | 185.000 | + Haut |
| 174.400 | 177.950 | 175.100 | 175.500 | 180.500 | + Bas |
| 184.113 | 182.950 | 181.345 | 180.092 | 179.253 | MM20 |
| 199.557 | 199.050 | 198.394 | 197.833 | 197.343 | MM50 |
| 198.997 | 199.104 | 199.012 | 198.904 | 198.725 | MM100 |
Performances historiques SARTORIUS STED BIO
| 5 jours | 1 mois | 1er janvier | 5 ans |
|---|---|---|---|
| +3.20 % | -12.28 % | -13.95 % | -50.41 % |
Court terme
Neutre
Moyen terme
Baissière
Long terme
Baissière
Portefeuille Trading
+335.20 % vs +71.82 % pour le CAC 40
Performance depuis le 28 mai 2008