


chiffres clés
Ouverture :
182.000 €
Perf Ouverture :
+0.60 %
+ Haut :
184.200 €
+ Bas :
181.150 €
Clôture veille :
182.000 €
Volume :
65 487
Capi échangé :
+0.07 %
Capi :
17 821 M€
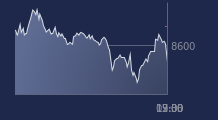
Graphique SARTORIUS STED BIO sur 5 jours
Cours SARTORIUS STED BIO sur 5 jours
| 23/02 | 24/02 | 25/02 | 26/02 | 27/02 | Date |
|---|---|---|---|---|---|
| 176.700(c) | 179.350(c) | 182.750(c) | 182.000(c) | 183.100(c) | Dernier |
| -3.31 % | +1.50 % | +1.90 % | -0.41 % | +0.60 % | Var. |
| 90 470 | 123 289 | 130 076 | 57 115 | 65 487 | Volume |
| 181.500 | 176.000 | 181.200 | 182.500 | 182.000 | Ouv. |
| 181.500 | 180.650 | 185.000 | 183.750 | 184.200 | + Haut |
| 175.100 | 175.500 | 180.500 | 179.700 | 181.150 | + Bas |
| 181.345 | 180.092 | 179.355 | 178.883 | 178.622 | MM20 |
| 198.394 | 197.833 | 197.384 | 196.878 | 196.374 | MM50 |
| 199.012 | 198.904 | 198.745 | 198.582 | 198.443 | MM100 |
Performances historiques SARTORIUS STED BIO
| 5 jours | 1 mois | 1er janvier | 5 ans |
|---|---|---|---|
| +0.19 % | -12.31 % | -12.81 % | -49.42 % |
Court terme
Neutre
Moyen terme
Baissière
Long terme
Baissière
Portefeuille Trading
+334.30 % vs +72.61 % pour le CAC 40
Performance depuis le 28 mai 2008