


chiffres clés
Ouverture :
28.400 €
Perf Ouverture :
-0.04 %
+ Haut :
28.560 €
+ Bas :
28.210 €
Clôture veille :
28.470 €
Volume :
274 216
Capi échangé :
+0.09 %
Capi :
8 396 M€
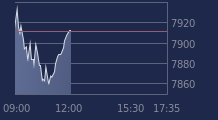
Graphique RENAULT sur 5 jours
Cours RENAULT sur 5 jours
| 10/03 | 11/03 | 12/03 | 13/03 | 16/03 | Date |
|---|---|---|---|---|---|
| 28.170(c) | 28.900(c) | 29.120(c) | 28.470(c) | 28.400 | Dernier |
| +0.39 % | +2.59 % | +0.76 % | -2.23 % | -0.25 % | Var. |
| 2 079 830 | 1 424 120 | 1 102 600 | 1 238 690 | 273 177 | Volume |
| 28.790 | 28.070 | 28.700 | 28.980 | 28.400 | Ouv. |
| 28.920 | 29.170 | 29.120 | 28.990 | 28.560 | + Haut |
| 28.020 | 28.060 | 28.500 | 28.410 | 28.210 | + Bas |
| 31.151 | 31.021 | 30.868 | 30.651 | 30.456 | MM20 |
| 32.154 | 32.023 | 31.897 | 31.739 | 31.595 | MM50 |
| 33.662 | 33.607 | 33.549 | 33.480 | 33.412 | MM100 |
Performances historiques RENAULT
| 5 jours | 1 mois | 1er janvier | 5 ans |
|---|---|---|---|
| +1.18 % | -13.45 % | -19.85 % | -27.20 % |
Court terme
Baissière
Moyen terme
Baissière
Long terme
Baissière
Portefeuille Trading
+331.60 % vs +59.20 % pour le CAC 40
Performance depuis le 28 mai 2008