


chiffres clés
Ouverture :
2.590 €
Perf Ouverture :
-0.77 %
+ Haut :
2.630 €
+ Bas :
2.500 €
Clôture veille :
2.610 €
Volume :
5 141
Capi échangé :
+0.04 %
Capi :
33 M€
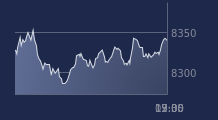
Graphique GENOWAY sur 5 jours
Cours GENOWAY sur 5 jours
| 13/07 | 14/07 | 15/07 | 16/07 | 17/07 | Date |
|---|---|---|---|---|---|
| 2.380(c) | 2.340(c) | 2.380(c) | 2.610(c) | 2.570(c) | Dernier |
| -0.83 % | -1.68 % | +1.71 % | +9.66 % | -1.53 % | Var. |
| 7 552 | 1 572 | 4 094 | 165 788 | 5 141 | Volume |
| 2.380 | 2.380 | 2.340 | 2.380 | 2.590 | Ouv. |
| 2.450 | 2.380 | 2.380 | 2.610 | 2.630 | + Haut |
| 2.330 | 2.280 | 2.300 | 2.310 | 2.500 | + Bas |
| 2.371 | 2.369 | 2.371 | 2.383 | 2.394 | MM20 |
| 2.406 | 2.405 | 2.404 | 2.408 | 2.409 | MM50 |
| 2.421 | 2.419 | 2.418 | 2.420 | 2.421 | MM100 |
Performances historiques GENOWAY
| 5 jours | 1 mois | 1er janvier | 5 ans |
|---|---|---|---|
| +7.08 % | +7.98 % | -5.17 % | -29.88 % |
Court terme
Haussière
Moyen terme
Haussière
Long terme
Haussière
Pas de conseil sur cette valeur
Portefeuille Trading
+318.20 % vs +67.75 % pour le CAC 40
Performance depuis le 28 mai 2008