


chiffres clés
LA BOURSE EN DIRECT
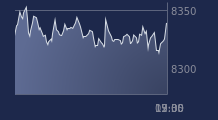
CAC 40
8338.97
0.15 %
SK Hynix progresse vivement pour ses premiers pas à Wall Street, le CAC 40 peu inspiré pour finir ...

L'indice vedette parisien grappille 0,15% à la clôture de ce vendredi 10 juillet. Le sud-coréen SK Hynix fait une entrée remarquée à Wall Street, réalisant la deuxième plus ...


Portefeuille Trading
+319.20 % vs +67.75 % pour le CAC 40
Performance depuis le 28 mai 2008
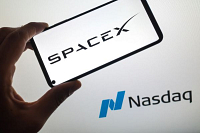
INTRODUCTIONS À VENIR
Les dernières INTRODUCTIONS