


chiffres clés
Ouverture :
175.320 €
Perf Ouverture :
+0.15 %
+ Haut :
176.500 €
+ Bas :
174.660 €
Clôture veille :
175.140 €
Volume :
165 758
Capi échangé :
+0.03 %
Capi :
112 048 M€
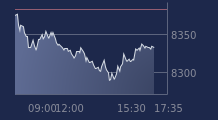
Graphique AIR LIQUIDE sur 5 jours
Cours AIR LIQUIDE sur 5 jours
| 10/07 | 13/07 | 14/07 | 15/07 | 16/07 | Date |
|---|---|---|---|---|---|
| 174.300(c) | 176.740(c) | 178.520(c) | 175.140(c) | 175.680 | Dernier |
| +0.77 % | +1.40 % | +1.01 % | -1.89 % | +0.31 % | Var. |
| 711 715 | 519 294 | 654 986 | 736 417 | 167 393 | Volume |
| 173.200 | 174.140 | 176.320 | 176.960 | 175.320 | Ouv. |
| 174.300 | 176.740 | 178.620 | 177.040 | 176.500 | + Haut |
| 172.520 | 174.000 | 175.960 | 174.640 | 174.660 | + Bas |
| 171.846 | 172.390 | 172.947 | 173.359 | 173.787 | MM20 |
| 166.654 | 166.959 | 167.267 | 167.492 | 167.792 | MM50 |
| 163.860 | 164.103 | 164.365 | 164.520 | 164.688 | MM100 |
Performances historiques AIR LIQUIDE
| 5 jours | 1 mois | 1er janvier | 5 ans |
|---|---|---|---|
| +1.51 % | +5.86 % | +20.52 % | +56.15 % |
Court terme
Neutre
Moyen terme
Haussière
Long terme
Haussière
Portefeuille Trading
+319.50 % vs +67.78 % pour le CAC 40
Performance depuis le 28 mai 2008