


chiffres clés
Ouverture :
0.860 €
Perf Ouverture :
+0.70 %
+ Haut :
0.866 €
+ Bas :
0.860 €
Clôture veille :
0.850 €
Volume :
1 878
Capi échangé :
+0.06 %
Capi :
3 M€
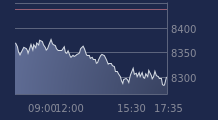
Graphique ACTEOS sur 5 jours
Cours ACTEOS sur 5 jours
| 17/07 | 20/07 | 21/07 | 22/07 | 23/07 | Date |
|---|---|---|---|---|---|
| 0.810(c) | 0.802(c) | 0.812(c) | 0.850(c) | 0.866(c) | Dernier |
| 0.00 % | -0.99 % | +1.25 % | +4.68 % | +1.88 % | Var. |
| 740 | 1 742 | 1 | 1 468 | 1 878 | Volume |
| 0.812 | 0.830 | 0.812 | 0.812 | 0.860 | Ouv. |
| 0.812 | 0.830 | 0.812 | 0.850 | 0.866 | + Haut |
| 0.810 | 0.802 | 0.812 | 0.812 | 0.860 | + Bas |
| 0.828 | 0.826 | 0.825 | 0.825 | 0.826 | MM20 |
| 0.881 | 0.879 | 0.877 | 0.875 | 0.874 | MM50 |
| 0.876 | 0.875 | 0.874 | 0.873 | 0.873 | MM100 |
Performances historiques ACTEOS
| 5 jours | 1 mois | 1er janvier | 5 ans |
|---|---|---|---|
| +6.91 % | +3.10 % | -11.45 % | -65.91 % |
Court terme
Haussière
Moyen terme
Neutre
Long terme
Baissière
Pas de conseil sur cette valeur
Portefeuille Trading
+317.00 % vs +66.95 % pour le CAC 40
Performance depuis le 28 mai 2008