


chiffres clés
Ouverture :
68.920 €
Perf Ouverture :
+0.06 %
+ Haut :
69.940 €
+ Bas :
68.920 €
Clôture veille :
68.800 €
Volume :
233 361
Capi échangé :
+0.13 %
Capi :
12 137 M€
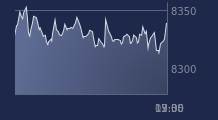
Graphique EUROFINS SCIENT. sur 5 jours
Cours EUROFINS SCIENT. sur 5 jours
| 06/07 | 07/07 | 08/07 | 09/07 | 10/07 | Date |
|---|---|---|---|---|---|
| 68.700(c) | 68.920(c) | 67.060(c) | 68.800(c) | 68.960(c) | Dernier |
| -0.95 % | +0.32 % | -2.70 % | +2.59 % | +0.23 % | Var. |
| 244 138 | 205 550 | 226 836 | 280 414 | 233 361 | Volume |
| 69.520 | 68.800 | 68.300 | 67.180 | 68.920 | Ouv. |
| 70.240 | 70.280 | 68.480 | 69.180 | 69.940 | + Haut |
| 68.700 | 68.800 | 66.720 | 66.600 | 68.920 | + Bas |
| 65.912 | 66.109 | 66.191 | 66.414 | 66.658 | MM20 |
| 62.947 | 63.095 | 63.241 | 63.466 | 63.665 | MM50 |
| 63.902 | 63.951 | 63.967 | 64.009 | 64.038 | MM100 |
Performances historiques EUROFINS SCIENT.
| 5 jours | 1 mois | 1er janvier | 5 ans |
|---|---|---|---|
| -0.58 % | +6.12 % | +10.51 % | -32.11 % |
Court terme
Haussière
Moyen terme
Haussière
Long terme
Haussière
Portefeuille Trading
+319.20 % vs +67.75 % pour le CAC 40
Performance depuis le 28 mai 2008