


chiffres clés
Ouverture :
5.100 €
Perf Ouverture :
-0.98 %
+ Haut :
5.120 €
+ Bas :
5.050 €
Clôture veille :
5.110 €
Volume :
27 370
Capi échangé :
+0.05 %
Capi :
302 M€
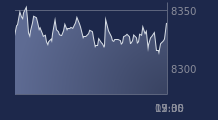
Graphique ABC ARBITRAGE sur 5 jours
Cours ABC ARBITRAGE sur 5 jours
| 06/07 | 07/07 | 08/07 | 09/07 | 10/07 | Date |
|---|---|---|---|---|---|
| 5.250(c) | 5.160(c) | 5.100(c) | 5.110(c) | 5.050(c) | Dernier |
| -0.19 % | -0.96 % | -1.16 % | +0.20 % | -1.17 % | Var. |
| 17 691 | 52 221 | 45 300 | 28 263 | 27 370 | Volume |
| 5.270 | 5.200 | 5.140 | 5.100 | 5.100 | Ouv. |
| 5.300 | 5.240 | 5.160 | 5.130 | 5.120 | + Haut |
| 5.230 | 5.130 | 5.050 | 5.040 | 5.050 | + Bas |
| 5.291 | 5.281 | 5.264 | 5.251 | 5.234 | MM20 |
| 5.278 | 5.274 | 5.268 | 5.262 | 5.256 | MM50 |
| 5.391 | 5.388 | 5.384 | 5.380 | 5.375 | MM100 |
Performances historiques ABC ARBITRAGE
| 5 jours | 1 mois | 1er janvier | 5 ans |
|---|---|---|---|
| -3.99 % | -5.96 % | -6.48 % | -29.67 % |
Court terme
Baissière
Moyen terme
Baissière
Long terme
Baissière
Portefeuille Trading
+319.20 % vs +67.75 % pour le CAC 40
Performance depuis le 28 mai 2008