


Ouverture :
-
Perf Ouverture :
-
+ Haut :
-
+ Bas :
-
Clôture veille :
5.300 €
Volume :
-
Capi échangé :
-
Capi :
318 M€
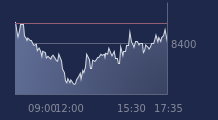
Graphique ABC ARBITRAGE sur 5 jours
Cours ABC ARBITRAGE sur 5 jours
| 17/06 | 18/06 | 19/06 | 22/06 | 23/06 | Date |
|---|---|---|---|---|---|
| 5.310(c) | 5.280(c) | 5.300(c) | 5.320(c) | - | Dernier |
| -1.12 % | -0.56 % | +0.38 % | +0.38 % | - | Var. |
| 48 798 | 47 244 | 25 002 | 24 703 | - | Volume |
| 5.380 | 5.350 | 5.270 | 5.300 | - | Ouv. |
| 5.380 | 5.350 | 5.310 | 5.320 | - | + Haut |
| 5.260 | 5.260 | 5.260 | 5.270 | - | + Bas |
| 5.317 | 5.317 | 5.323 | 5.331 | - | MM20 |
| 5.308 | 5.304 | 5.301 | 5.299 | - | MM50 |
| 5.423 | 5.422 | 5.422 | 5.420 | - | MM100 |
Performances historiques ABC ARBITRAGE
| 5 jours | 1 mois | 1er janvier | 5 ans |
|---|---|---|---|
| -1.12 % | +0.76 % | -1.48 % | -25.49 % |
Court terme
Neutre
Moyen terme
Neutre
Long terme
Baissière
Portefeuille Trading
+322.30 % vs +68.98 % pour le CAC 40
Performance depuis le 28 mai 2008