


chiffres clés
Ouverture :
7.750 €
Perf Ouverture :
-0.39 %
+ Haut :
7.765 €
+ Bas :
7.695 €
Clôture veille :
7.745 €
Volume :
22 668
Capi échangé :
+0.04 %
Capi :
433 M€
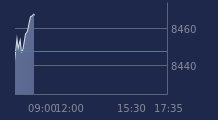
Graphique NEXITY sur 5 jours
Cours NEXITY sur 5 jours
| 11/06 | 12/06 | 15/06 | 16/06 | 17/06 | Date |
|---|---|---|---|---|---|
| 7.690(c) | 7.830(c) | 7.890(c) | 7.745(c) | 7.720 | Dernier |
| +0.72 % | +1.82 % | +0.77 % | -1.84 % | -0.32 % | Var. |
| 128 614 | 152 216 | 161 515 | 136 386 | 22 668 | Volume |
| 7.600 | 7.825 | 8.095 | 7.890 | 7.750 | Ouv. |
| 7.820 | 8.080 | 8.170 | 7.945 | 7.765 | + Haut |
| 7.555 | 7.815 | 7.870 | 7.655 | 7.695 | + Bas |
| 8.018 | 7.987 | 7.972 | 7.950 | 7.919 | MM20 |
| 8.397 | 8.394 | 8.385 | 8.371 | 8.358 | MM50 |
| 8.493 | 8.487 | 8.485 | 8.478 | 8.473 | MM100 |
Performances historiques NEXITY
| 5 jours | 1 mois | 1er janvier | 5 ans |
|---|---|---|---|
| +1.11 % | -8.48 % | -13.98 % | -81.42 % |
Court terme
Baissière
Moyen terme
Baissière
Long terme
Baissière
Portefeuille Trading
+325.20 % vs +70.29 % pour le CAC 40
Performance depuis le 28 mai 2008