


chiffres clés
Ouverture :
58.200 €
Perf Ouverture :
+0.09 %
+ Haut :
58.450 €
+ Bas :
57.400 €
Clôture veille :
58.150 €
Volume :
64 172
Capi échangé :
+0.08 %
Capi :
4 431 M€
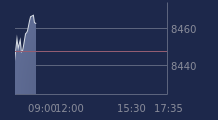
Graphique ARKEMA sur 5 jours
Cours ARKEMA sur 5 jours
| 11/06 | 12/06 | 15/06 | 16/06 | 17/06 | Date |
|---|---|---|---|---|---|
| 57.400(c) | 57.400(c) | 57.900(c) | 58.150(c) | 58.250 | Dernier |
| 0.00 % | 0.00 % | +0.87 % | +0.43 % | +0.17 % | Var. |
| 231 306 | 267 653 | 288 879 | 218 901 | 64 172 | Volume |
| 57.450 | 57.950 | 57.750 | 58.000 | 58.200 | Ouv. |
| 58.350 | 58.000 | 59.150 | 58.600 | 58.450 | + Haut |
| 57.350 | 56.750 | 57.400 | 57.700 | 57.400 | + Bas |
| 60.273 | 60.010 | 59.800 | 59.688 | 59.573 | MM20 |
| 61.005 | 60.987 | 60.964 | 60.965 | 60.977 | MM50 |
| 58.686 | 58.775 | 58.854 | 58.915 | 58.977 | MM100 |
Performances historiques ARKEMA
| 5 jours | 1 mois | 1er janvier | 5 ans |
|---|---|---|---|
| +1.48 % | -7.02 % | +11.70 % | -46.16 % |
Court terme
Baissière
Moyen terme
Neutre
Long terme
Haussière
Portefeuille Trading
+325.20 % vs +70.14 % pour le CAC 40
Performance depuis le 28 mai 2008