


chiffres clés
Ouverture :
50.450 €
Perf Ouverture :
+2.87 %
+ Haut :
52.200 €
+ Bas :
50.450 €
Clôture veille :
50.000 €
Volume :
33 381
Capi échangé :
+0.02 %
Capi :
8 790 M€
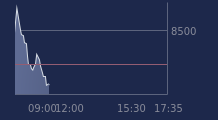
Graphique SPIE sur 5 jours
Cours SPIE sur 5 jours
| 29/06 | 30/06 | 01/07 | 02/07 | 03/07 | Date |
|---|---|---|---|---|---|
| 50.050(c) | 50.400(c) | 50.050(c) | 50.000(c) | 51.900 | Dernier |
| -2.25 % | +0.70 % | -0.69 % | -0.10 % | +3.80 % | Var. |
| 280 202 | 376 446 | 302 343 | 507 391 | 33 381 | Volume |
| 51.150 | 50.500 | 50.800 | 49.900 | 50.450 | Ouv. |
| 51.200 | 50.850 | 50.800 | 50.550 | 52.200 | + Haut |
| 50.050 | 50.050 | 49.740 | 49.460 | 50.450 | + Bas |
| 49.506 | 49.561 | 49.630 | 49.695 | 49.873 | MM20 |
| 48.935 | 49.002 | 49.074 | 49.154 | 49.277 | MM50 |
| 48.351 | 48.395 | 48.412 | 48.424 | 48.458 | MM100 |
Performances historiques SPIE
| 5 jours | 1 mois | 1er janvier | 5 ans |
|---|---|---|---|
| +1.37 % | +5.27 % | +5.36 % | +159.24 % |
Court terme
Neutre
Moyen terme
Haussière
Long terme
Haussière
Portefeuille Trading
+320.80 % vs +70.19 % pour le CAC 40
Performance depuis le 28 mai 2008