Ouverture :
32.000 €
Perf Ouverture :
+4.59 %
+ Haut :
34.755 €
+ Bas :
32.000 €
Clôture veille :
32.000 €
Volume :
15 798
Capi échangé :
+0.15 %
Capi :
344 M€
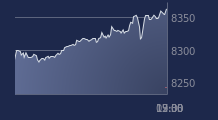
Graphique SEMCO TECHNOLOGIES sur 5 jours
Cours SEMCO TECHNOLOGIES sur 5 jours
| 06/01 | 07/01 | 08/01 | 09/01 | 09/01 | Date |
|---|---|---|---|---|---|
| 29.7 | 32.17 | 32 | 33.47 | 33.47 | Dernier |
| +2.70 % | +8.32 % | -0.53 % | +4.59 % | +4.59 % | Var. |
| 12955 | 31018 | 12552 | 15798 | 15798 | Volume |
| 28.93 | 30.3 | 32.2 | 32 | 32 | Ouv. |
| 29.7 | 32.6 | 32.49 | 34.755 | 34.755 | + Haut |
| 28.45 | 30 | 31.5 | 32 | 32 | + Bas |
| 27.45 | 27.792 | 28.077 | 28.4255 | 28.4255 | MM20 |
| 26.197 | 26.3255 | 26.4469 | 26.6053 | 26.6053 | MM50 |
| 25.7776 | 25.8502 | 25.9192 | 25.9841 | 25.9841 | MM100 |
Performances historiques SEMCO TECHNOLOGIES
| 5 jours | 1 mois | 1er janvier | 5 ans |
|---|---|---|---|
| +18.88 % | +27.26 % | +19.43 % | 0.00 % |
Court terme
Haussière
Moyen terme
Haussière
Long terme
Haussière
Pas de conseil sur cette valeur
Portefeuille Trading
+335.10 % vs +68.21 % pour le CAC 40
Performance depuis le 28 mai 2008


