


chiffres clés
Ouverture :
0.848 €
Perf Ouverture :
-0.24 %
+ Haut :
0.866 €
+ Bas :
0.842 €
Clôture veille :
0.846 €
Volume :
114 751
Capi échangé :
+0.22 %
Capi :
44 M€
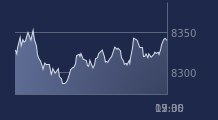
Graphique PRODWAYS GROUP sur 5 jours
Cours PRODWAYS GROUP sur 5 jours
| 13/07 | 14/07 | 15/07 | 16/07 | 17/07 | Date |
|---|---|---|---|---|---|
| 0.854(c) | 0.868(c) | 0.866(c) | 0.846(c) | 0.846(c) | Dernier |
| 0.00 % | +1.64 % | -0.23 % | -2.31 % | 0.00 % | Var. |
| 320 489 | 64 372 | 22 019 | 56 033 | 114 751 | Volume |
| 0.852 | 0.864 | 0.858 | 0.864 | 0.848 | Ouv. |
| 0.870 | 0.868 | 0.866 | 0.864 | 0.866 | + Haut |
| 0.850 | 0.850 | 0.858 | 0.842 | 0.842 | + Bas |
| 0.781 | 0.785 | 0.790 | 0.794 | 0.798 | MM20 |
| 0.782 | 0.783 | 0.784 | 0.785 | 0.786 | MM50 |
| 0.748 | 0.751 | 0.755 | 0.758 | 0.761 | MM100 |
Performances historiques PRODWAYS GROUP
| 5 jours | 1 mois | 1er janvier | 5 ans |
|---|---|---|---|
| -0.94 % | +8.46 % | +52.71 % | -70.11 % |
Court terme
Haussière
Moyen terme
Haussière
Long terme
Haussière
Pas de conseil sur cette valeur
Portefeuille Trading
+318.20 % vs +67.75 % pour le CAC 40
Performance depuis le 28 mai 2008