


chiffres clés
Ouverture :
14.700 €
Perf Ouverture :
+0.88 %
+ Haut :
14.860 €
+ Bas :
14.700 €
Clôture veille :
14.640 €
Volume :
17 315
Capi échangé :
+0.01 %
Capi :
2 136 M€
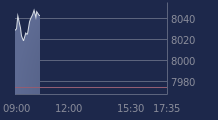
Graphique OPMOBILITY (EX-PLASTIC OMNIUM) sur 5 jours
Cours OPMOBILITY (EX-PLASTIC OMNIUM) sur 5 jours
| 12/03 | 13/03 | 16/03 | 17/03 | 18/03 | Date |
|---|---|---|---|---|---|
| 15.000(c) | 14.840(c) | 14.640(c) | 14.640(c) | 14.830 | Dernier |
| -2.02 % | -1.07 % | -1.35 % | 0.00 % | +1.30 % | Var. |
| 92 006 | 121 161 | 83 948 | 89 014 | 17 315 | Volume |
| 15.160 | 14.860 | 14.680 | 14.580 | 14.700 | Ouv. |
| 15.320 | 15.340 | 14.740 | 14.900 | 14.860 | + Haut |
| 14.880 | 14.790 | 14.420 | 14.520 | 14.700 | + Bas |
| 16.238 | 16.136 | 16.025 | 15.910 | 15.792 | MM20 |
| 16.353 | 16.322 | 16.291 | 16.254 | 16.222 | MM50 |
| 15.558 | 15.564 | 15.568 | 15.571 | 15.573 | MM100 |
Performances historiques OPMOBILITY (EX-PLASTIC OMNIUM)
| 5 jours | 1 mois | 1er janvier | 5 ans |
|---|---|---|---|
| -3.14 % | -12.40 % | -7.14 % | -55.30 % |
Court terme
Baissière
Moyen terme
Baissière
Long terme
Neutre
Portefeuille Trading
+335.50 % vs +61.91 % pour le CAC 40
Performance depuis le 28 mai 2008