


chiffres clés
Ouverture :
0.318 €
Perf Ouverture :
-1.57 %
+ Haut :
0.321 €
+ Bas :
0.311 €
Clôture veille :
0.320 €
Volume :
18 652
Capi échangé :
+0.05 %
Capi :
12 M€
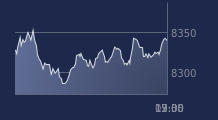
Graphique NEXTEDIA sur 5 jours
Cours NEXTEDIA sur 5 jours
| 13/07 | 14/07 | 15/07 | 16/07 | 17/07 | Date |
|---|---|---|---|---|---|
| 0.320(c) | 0.320(c) | 0.314(c) | 0.320(c) | 0.313(c) | Dernier |
| -2.74 % | 0.00 % | -1.88 % | +1.91 % | -2.19 % | Var. |
| 21 911 | 10 760 | 39 499 | 17 233 | 18 652 | Volume |
| 0.329 | 0.315 | 0.319 | 0.315 | 0.318 | Ouv. |
| 0.329 | 0.320 | 0.321 | 0.321 | 0.321 | + Haut |
| 0.315 | 0.311 | 0.313 | 0.315 | 0.311 | + Bas |
| 0.352 | 0.349 | 0.346 | 0.344 | 0.341 | MM20 |
| 0.361 | 0.361 | 0.360 | 0.359 | 0.358 | MM50 |
| 0.371 | 0.370 | 0.368 | 0.367 | 0.367 | MM100 |
Performances historiques NEXTEDIA
| 5 jours | 1 mois | 1er janvier | 5 ans |
|---|---|---|---|
| -4.86 % | -15.86 % | -22.52 % | -70.42 % |
Court terme
Baissière
Moyen terme
Baissière
Long terme
Baissière
Pas de conseil sur cette valeur
Portefeuille Trading
+318.20 % vs +67.75 % pour le CAC 40
Performance depuis le 28 mai 2008