


chiffres clés
Ouverture :
11.480 €
Perf Ouverture :
+0.87 %
+ Haut :
11.640 €
+ Bas :
11.440 €
Clôture veille :
11.520 €
Volume :
263 450
Capi échangé :
+0.21 %
Capi :
1 464 M€
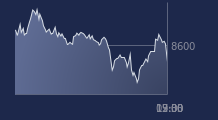
Graphique METROPOLE TV sur 5 jours
Cours METROPOLE TV sur 5 jours
| 23/02 | 24/02 | 25/02 | 26/02 | 27/02 | Date |
|---|---|---|---|---|---|
| 11.460(c) | 11.400(c) | 11.340(c) | 11.520(c) | 11.580(c) | Dernier |
| -1.21 % | -0.52 % | -0.53 % | +1.59 % | +0.52 % | Var. |
| 289 052 | 163 239 | 216 404 | 183 007 | 263 450 | Volume |
| 11.540 | 11.480 | 11.400 | 11.360 | 11.480 | Ouv. |
| 11.660 | 11.600 | 11.520 | 11.540 | 11.640 | + Haut |
| 11.380 | 11.400 | 11.340 | 11.320 | 11.440 | + Bas |
| 11.881 | 11.850 | 11.812 | 11.781 | 11.756 | MM20 |
| 11.894 | 11.890 | 11.883 | 11.879 | 11.873 | MM50 |
| 12.065 | 12.052 | 12.040 | 12.029 | 12.020 | MM100 |
Performances historiques METROPOLE TV
| 5 jours | 1 mois | 1er janvier | 5 ans |
|---|---|---|---|
| -0.17 % | -1.86 % | -4.93 % | -30.07 % |
Court terme
Baissière
Moyen terme
Baissière
Long terme
Baissière
Portefeuille Trading
+334.30 % vs +72.61 % pour le CAC 40
Performance depuis le 28 mai 2008