


chiffres clés
Ouverture :
0.158 €
Perf Ouverture :
+0.63 %
+ Haut :
0.164 €
+ Bas :
0.158 €
Clôture veille :
0.163 €
Volume :
136 126
Capi échangé :
+0.07 %
Capi :
31 M€
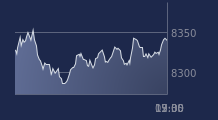
Graphique MAUNA KEA TECH sur 5 jours
Cours MAUNA KEA TECH sur 5 jours
| 13/07 | 14/07 | 15/07 | 16/07 | 17/07 | Date |
|---|---|---|---|---|---|
| 0.163(c) | 0.163(c) | 0.161(c) | 0.163(c) | 0.159(c) | Dernier |
| -2.05 % | +0.25 % | -1.10 % | +0.87 % | -2.21 % | Var. |
| 60 553 | 78 432 | 84 062 | 173 976 | 136 126 | Volume |
| 0.166 | 0.160 | 0.163 | 0.162 | 0.158 | Ouv. |
| 0.168 | 0.164 | 0.164 | 0.163 | 0.164 | + Haut |
| 0.163 | 0.160 | 0.160 | 0.157 | 0.158 | + Bas |
| 0.161 | 0.161 | 0.162 | 0.162 | 0.162 | MM20 |
| 0.170 | 0.170 | 0.169 | 0.169 | 0.169 | MM50 |
| 0.176 | 0.176 | 0.176 | 0.177 | 0.177 | MM100 |
Performances historiques MAUNA KEA TECH
| 5 jours | 1 mois | 1er janvier | 5 ans |
|---|---|---|---|
| -4.22 % | -5.02 % | +117.51 % | -85.14 % |
Court terme
Neutre
Moyen terme
Neutre
Long terme
Neutre
Pas de conseil sur cette valeur
Portefeuille Trading
+318.20 % vs +67.75 % pour le CAC 40
Performance depuis le 28 mai 2008