Ouverture :
34.360 €
Perf Ouverture :
-1.34 %
+ Haut :
34.360 €
+ Bas :
33.820 €
Clôture veille :
34.360 €
Volume :
327 910
Capi échangé :
+0.11 %
Capi :
9 725 M€
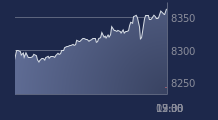
Graphique KLEPIERRE sur 5 jours
Cours KLEPIERRE sur 5 jours
| 06/01 | 07/01 | 08/01 | 09/01 | 09/01 | Date |
|---|---|---|---|---|---|
| 33.18 | 34.3 | 34.36 | 33.9 | 33.9 | Dernier |
| +0.73 % | +3.38 % | +0.17 % | -1.34 % | -1.34 % | Var. |
| 498520 | 719502 | 510065 | 327910 | 327910 | Volume |
| 32.98 | 33.26 | 34.32 | 34.36 | 34.36 | Ouv. |
| 33.18 | 34.3 | 34.42 | 34.36 | 34.36 | + Haut |
| 32.52 | 33.26 | 33.94 | 33.82 | 33.82 | + Bas |
| 33.344 | 33.412 | 33.477 | 33.518 | 33.518 | MM20 |
| 33.39 | 33.4048 | 33.4284 | 33.4396 | 33.4396 | MM50 |
| 33.3038 | 33.2992 | 33.2944 | 33.2842 | 33.2842 | MM100 |
Performances historiques KLEPIERRE
| 5 jours | 1 mois | 1er janvier | 5 ans |
|---|---|---|---|
| +1.80 % | +2.54 % | +0.47 % | +80.70 % |
Court terme
Haussière
Moyen terme
Haussière
Long terme
Neutre
Portefeuille Trading
+335.10 % vs +68.21 % pour le CAC 40
Performance depuis le 28 mai 2008


