


chiffres clés
Ouverture :
1 768.000 €
Perf Ouverture :
-0.59 %
+ Haut :
1 799.500 €
+ Bas :
1 757.500 €
Clôture veille :
1 751.500 €
Volume :
102 599
Capi échangé :
+0.10 %
Capi :
185 538 M€
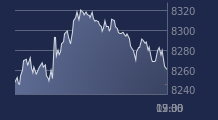
Graphique HERMES INTL sur 5 jours
Cours HERMES INTL sur 5 jours
| 02/04 | 07/04 | 08/04 | 09/04 | 10/04 | Date |
|---|---|---|---|---|---|
| 1667.500(c) | 1648.500(c) | 1768.000(c) | 1751.500(c) | 1757.500(c) | Dernier |
| -0.12 % | -1.14 % | +7.25 % | -0.93 % | +0.34 % | Var. |
| 70 367 | 75 005 | 150 437 | 96 264 | 102 599 | Volume |
| 1657.000 | 1682.000 | 1747.500 | 1748.000 | 1768.000 | Ouv. |
| 1672.000 | 1712.000 | 1792.000 | 1754.000 | 1799.500 | + Haut |
| 1624.500 | 1643.000 | 1724.500 | 1726.500 | 1757.500 | + Bas |
| 1760.950 | 1748.100 | 1741.300 | 1731.470 | 1723.320 | MM20 |
| 1939.160 | 1929.530 | 1922.090 | 1914.520 | 1908.670 | MM50 |
| 2037.560 | 2032.420 | 2028.090 | 2023.970 | 2019.980 | MM100 |
Performances historiques HERMES INTL
| 5 jours | 1 mois | 1er janvier | 5 ans |
|---|---|---|---|
| +5.40 % | -7.69 % | -17.18 % | +77.60 % |
Court terme
Neutre
Moyen terme
Baissière
Long terme
Baissière
Portefeuille Trading
+332.70 % vs +66.15 % pour le CAC 40
Performance depuis le 28 mai 2008