


chiffres clés
Ouverture :
87.490 €
Perf Ouverture :
-0.21 %
+ Haut :
87.850 €
+ Bas :
86.240 €
Clôture veille :
87.200 €
Volume :
629 147
Capi échangé :
+0.06 %
Capi :
96 181 M€
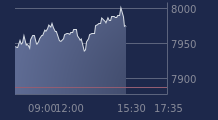
Graphique BNP PARIBAS ACT.A sur 5 jours
Cours BNP PARIBAS ACT.A sur 5 jours
| 23/10 | 26/10 | 27/10 | 28/10 | 29/10 | Date |
|---|---|---|---|---|---|
| 83.520(c) | 85.550(c) | 86.960(c) | 87.200(c) | 87.410 | Dernier |
| +1.15 % | +2.43 % | +1.65 % | +0.28 % | +0.24 % | Var. |
| 3 123 360 | 2 798 850 | 2 381 700 | 2 172 660 | 607 498 | Volume |
| 83.280 | 84.220 | 85.180 | 87.730 | 87.490 | Ouv. |
| 83.550 | 86.030 | 87.050 | 88.520 | 87.850 | + Haut |
| 81.880 | 84.220 | 84.920 | 85.980 | 86.240 | + Bas |
| 90.412 | 89.777 | 89.255 | 88.865 | 88.658 | MM20 |
| 98.304 | 97.792 | 97.344 | 96.952 | 96.581 | MM50 |
| 101.052 | 100.976 | 100.912 | 100.864 | 100.819 | MM100 |
Performances historiques BNP PARIBAS ACT.A
| 5 jours | 1 mois | 1er janvier | 5 ans |
|---|---|---|---|
| +5.74 % | -11.14 % | +8.07 % | +51.95 % |
Court terme
Baissière
Moyen terme
Baissière
Long terme
Baissière
Portefeuille Trading
+317.70 % vs +60.32 % pour le CAC 40
Performance depuis le 28 mai 2008