


chiffres clés
Ouverture :
32.800 €
Perf Ouverture :
0.00 %
+ Haut :
32.800 €
+ Bas :
32.600 €
Clôture veille :
32.800 €
Volume :
52
Capi échangé :
+0.00 %
Capi :
356 M€
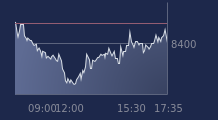
Graphique FONCIERE INEA sur 5 jours
Cours FONCIERE INEA sur 5 jours
| 17/06 | 18/06 | 19/06 | 22/06 | 23/06 | Date |
|---|---|---|---|---|---|
| 33.000(c) | 32.800(c) | 32.800(c) | 32.800(c) | - | Dernier |
| +0.30 % | -0.61 % | 0.00 % | 0.00 % | - | Var. |
| 122 | 796 | 439 | 52 | - | Volume |
| 32.900 | 32.900 | 32.800 | 32.800 | - | Ouv. |
| 33.000 | 32.900 | 33.000 | 32.800 | - | + Haut |
| 32.900 | 32.300 | 32.300 | 32.600 | - | + Bas |
| 33.815 | 33.675 | 33.530 | 33.355 | - | MM20 |
| 34.454 | 34.410 | 34.366 | 34.328 | - | MM50 |
| 34.450 | 34.437 | 34.423 | 34.411 | - | MM100 |
Performances historiques FONCIERE INEA
| 5 jours | 1 mois | 1er janvier | 5 ans |
|---|---|---|---|
| -0.61 % | -7.87 % | -4.09 % | -20.58 % |
Court terme
Baissière
Moyen terme
Baissière
Long terme
Baissière
Portefeuille Trading
+322.30 % vs +68.98 % pour le CAC 40
Performance depuis le 28 mai 2008