


chiffres clés
Ouverture :
3.035 €
Perf Ouverture :
-4.78 %
+ Haut :
3.070 €
+ Bas :
2.770 €
Clôture veille :
3.090 €
Volume :
191 906
Capi échangé :
+0.71 %
Capi :
78 M€
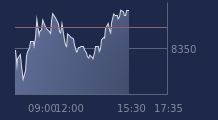
Graphique EKINOPS sur 5 jours
Cours EKINOPS sur 5 jours
| 09/07 | 10/07 | 13/07 | 14/07 | 15/07 | Date |
|---|---|---|---|---|---|
| 2.375(c) | 2.615(c) | 2.785(c) | 3.090(c) | 2.890 | Dernier |
| -0.42 % | +10.11 % | +6.50 % | +10.95 % | -6.47 % | Var. |
| 117 575 | 416 835 | 283 036 | 333 717 | 191 906 | Volume |
| 2.390 | 2.570 | 2.535 | 2.810 | 3.035 | Ouv. |
| 2.440 | 2.790 | 2.870 | 3.090 | 3.070 | + Haut |
| 2.345 | 2.505 | 2.505 | 2.750 | 2.770 | + Bas |
| 2.673 | 2.662 | 2.665 | 2.685 | 2.693 | MM20 |
| 2.848 | 2.850 | 2.855 | 2.865 | 2.869 | MM50 |
| 2.471 | 2.476 | 2.482 | 2.491 | 2.498 | MM100 |
Performances historiques EKINOPS
| 5 jours | 1 mois | 1er janvier | 5 ans |
|---|---|---|---|
| +21.17 % | +2.30 % | +49.74 % | -62.61 % |
Court terme
Haussière
Moyen terme
Haussière
Long terme
Haussière
Pas de conseil sur cette valeur
Portefeuille Trading
+318.90 % vs +68.53 % pour le CAC 40
Performance depuis le 28 mai 2008