


chiffres clés
Ouverture :
16.335 €
Perf Ouverture :
+0.95 %
+ Haut :
16.490 €
+ Bas :
16.300 €
Clôture veille :
16.335 €
Volume :
1 199 250
Capi échangé :
+0.16 %
Capi :
12 142 M€
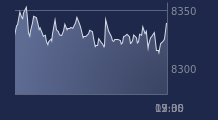
Graphique CARREFOUR sur 5 jours
Cours CARREFOUR sur 5 jours
| 06/07 | 07/07 | 08/07 | 09/07 | 10/07 | Date |
|---|---|---|---|---|---|
| 15.920(c) | 16.510(c) | 16.420(c) | 16.335(c) | 16.490(c) | Dernier |
| -1.24 % | +3.71 % | -0.55 % | -0.52 % | +0.95 % | Var. |
| 1 438 200 | 3 354 810 | 1 967 680 | 1 498 680 | 1 199 250 | Volume |
| 16.100 | 16.295 | 16.415 | 16.355 | 16.335 | Ouv. |
| 16.120 | 16.655 | 16.465 | 16.485 | 16.490 | + Haut |
| 15.875 | 16.205 | 16.310 | 16.200 | 16.300 | + Bas |
| 16.210 | 16.222 | 16.227 | 16.216 | 16.204 | MM20 |
| 16.510 | 16.511 | 16.506 | 16.500 | 16.491 | MM50 |
| 16.158 | 16.168 | 16.175 | 16.183 | 16.194 | MM100 |
Performances historiques CARREFOUR
| 5 jours | 1 mois | 1er janvier | 5 ans |
|---|---|---|---|
| +2.30 % | +1.38 % | +15.88 % | +0.86 % |
Court terme
Neutre
Moyen terme
Baissière
Long terme
Neutre
Portefeuille Trading
+319.20 % vs +67.75 % pour le CAC 40
Performance depuis le 28 mai 2008