


chiffres clés
Ouverture :
70.450 €
Perf Ouverture :
+0.85 %
+ Haut :
71.150 €
+ Bas :
70.250 €
Clôture veille :
70.400 €
Volume :
17 294
Capi échangé :
+0.01 %
Capi :
8 410 M€
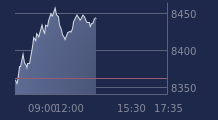
Graphique BIOMERIEUX sur 5 jours
Cours BIOMERIEUX sur 5 jours
| 16/07 | 17/07 | 20/07 | 21/07 | 22/07 | Date |
|---|---|---|---|---|---|
| 72.700(c) | 73.000(c) | 72.200(c) | 70.400(c) | 71.050 | Dernier |
| +1.18 % | +0.41 % | -1.10 % | -2.49 % | +0.92 % | Var. |
| 168 846 | 166 709 | 226 244 | 170 835 | 17 138 | Volume |
| 71.400 | 73.150 | 72.950 | 72.150 | 70.450 | Ouv. |
| 72.750 | 73.950 | 73.000 | 72.150 | 71.150 | + Haut |
| 71.000 | 72.850 | 71.900 | 69.400 | 70.250 | + Bas |
| 69.883 | 70.083 | 70.328 | 70.518 | 70.663 | MM20 |
| 70.871 | 70.909 | 70.916 | 70.848 | 70.776 | MM50 |
| 79.758 | 79.533 | 79.298 | 79.038 | 78.749 | MM100 |
Performances historiques BIOMERIEUX
| 5 jours | 1 mois | 1er janvier | 5 ans |
|---|---|---|---|
| -1.11 % | +2.97 % | -35.58 % | -24.03 % |
Court terme
Neutre
Moyen terme
Neutre
Long terme
Baissière
Portefeuille Trading
+318.60 % vs +69.84 % pour le CAC 40
Performance depuis le 28 mai 2008