


chiffres clés
Ouverture :
44.300 €
Perf Ouverture :
+2.37 %
+ Haut :
45.350 €
+ Bas :
44.200 €
Clôture veille :
45.500 €
Volume :
4 496
Capi échangé :
+0.04 %
Capi :
578 M€
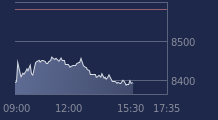
Graphique AUBAY sur 5 jours
Cours AUBAY sur 5 jours
| 24/02 | 25/02 | 26/02 | 27/02 | 02/03 | Date |
|---|---|---|---|---|---|
| 43.500(c) | 44.250(c) | 45.750(c) | 45.500(c) | 45.350 | Dernier |
| -2.25 % | +1.72 % | +3.39 % | -0.55 % | -0.33 % | Var. |
| 19 811 | 12 092 | 9 437 | 11 136 | 4 496 | Volume |
| 44.100 | 43.000 | 44.250 | 45.800 | 44.300 | Ouv. |
| 44.200 | 44.550 | 45.750 | 45.900 | 45.350 | + Haut |
| 42.800 | 42.950 | 44.150 | 44.950 | 44.200 | + Bas |
| 52.175 | 51.503 | 50.795 | 50.075 | 49.278 | MM20 |
| 54.918 | 54.713 | 54.520 | 54.304 | 54.111 | MM50 |
| 51.821 | 51.780 | 51.760 | 51.742 | 51.725 | MM100 |
Performances historiques AUBAY
| 5 jours | 1 mois | 1er janvier | 5 ans |
|---|---|---|---|
| +1.91 % | -24.29 % | -20.58 % | +19.19 % |
Court terme
Baissière
Moyen terme
Baissière
Long terme
Baissière
Portefeuille Trading
+334.30 % vs +68.98 % pour le CAC 40
Performance depuis le 28 mai 2008