


chiffres clés
Ouverture :
0.936 €
Perf Ouverture :
-1.71 %
+ Haut :
0.938 €
+ Bas :
0.920 €
Clôture veille :
0.930 €
Volume :
301
Capi échangé :
+0.01 %
Capi :
3 M€
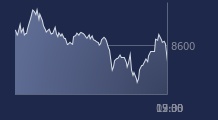
Graphique ACTEOS sur 5 jours
Cours ACTEOS sur 5 jours
| 23/02 | 24/02 | 25/02 | 26/02 | 27/02 | Date |
|---|---|---|---|---|---|
| 0.906(c) | 0.938(c) | 0.936(c) | 0.930(c) | 0.920(c) | Dernier |
| -3.62 % | +3.53 % | -0.21 % | -0.64 % | -1.08 % | Var. |
| 4 712 | 1 754 | 142 | 261 | 301 | Volume |
| 0.930 | 0.922 | 0.940 | 0.934 | 0.936 | Ouv. |
| 0.938 | 0.938 | 0.940 | 0.934 | 0.938 | + Haut |
| 0.900 | 0.920 | 0.920 | 0.920 | 0.920 | + Bas |
| 0.951 | 0.950 | 0.949 | 0.949 | 0.946 | MM20 |
| 0.948 | 0.948 | 0.947 | 0.947 | 0.948 | MM50 |
| 0.982 | 0.982 | 0.981 | 0.979 | 0.977 | MM100 |
Performances historiques ACTEOS
| 5 jours | 1 mois | 1er janvier | 5 ans |
|---|---|---|---|
| -2.13 % | -2.95 % | -5.93 % | -71.95 % |
Court terme
Baissière
Moyen terme
Neutre
Long terme
Neutre
Pas de conseil sur cette valeur
Portefeuille Trading
+334.30 % vs +72.61 % pour le CAC 40
Performance depuis le 28 mai 2008