


chiffres clés
Ouverture :
5.670 €
Perf Ouverture :
+1.59 %
+ Haut :
5.760 €
+ Bas :
5.650 €
Clôture veille :
5.750 €
Volume :
14 842
Capi échangé :
+0.02 %
Capi :
343 M€
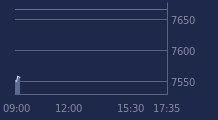
Graphique ABC ARBITRAGE sur 5 jours
Cours ABC ARBITRAGE sur 5 jours
| 17/03 | 18/03 | 19/03 | 20/03 | 23/03 | Date |
|---|---|---|---|---|---|
| 5.780(c) | 5.850(c) | 5.860(c) | 5.750(c) | 5.760 | Dernier |
| -0.17 % | +1.21 % | +0.17 % | -1.88 % | +0.17 % | Var. |
| 19 988 | 43 939 | 45 306 | 58 089 | 14 842 | Volume |
| 5.790 | 5.790 | 5.840 | 5.840 | 5.670 | Ouv. |
| 5.800 | 5.860 | 5.920 | 5.890 | 5.760 | + Haut |
| 5.720 | 5.760 | 5.800 | 5.740 | 5.650 | + Bas |
| 5.664 | 5.680 | 5.695 | 5.701 | 5.703 | MM20 |
| 5.534 | 5.541 | 5.550 | 5.556 | 5.563 | MM50 |
| 5.469 | 5.471 | 5.474 | 5.476 | 5.479 | MM100 |
Performances historiques ABC ARBITRAGE
| 5 jours | 1 mois | 1er janvier | 5 ans |
|---|---|---|---|
| -0.52 % | +2.13 % | +6.67 % | -29.06 % |
Court terme
Haussière
Moyen terme
Haussière
Long terme
Haussière
Portefeuille Trading
+336.60 % vs +51.82 % pour le CAC 40
Performance depuis le 28 mai 2008