


chiffres clés
Ouverture :
60.100 €
Perf Ouverture :
+0.67 %
+ Haut :
60.600 €
+ Bas :
59.900 €
Clôture veille :
60.100 €
Volume :
16 188
Capi échangé :
+0.06 %
Capi :
1 559 M€
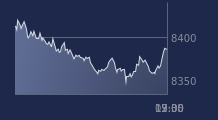
Graphique ARGAN sur 5 jours
Cours ARGAN sur 5 jours
| 22/06 | 23/06 | 24/06 | 25/06 | 26/06 | Date |
|---|---|---|---|---|---|
| 59.500(c) | 59.300(c) | 60.700(c) | 60.100(c) | 60.500(c) | Dernier |
| +0.68 % | -0.34 % | +2.36 % | -0.99 % | +0.67 % | Var. |
| 13 886 | 9 417 | 14 735 | 14 105 | 16 188 | Volume |
| 59.300 | 59.400 | 59.400 | 60.700 | 60.100 | Ouv. |
| 59.500 | 59.400 | 60.700 | 61.100 | 60.600 | + Haut |
| 58.900 | 58.700 | 59.400 | 60.100 | 59.900 | + Bas |
| 59.660 | 59.580 | 59.540 | 59.480 | 59.445 | MM20 |
| 60.656 | 60.634 | 60.618 | 60.580 | 60.542 | MM50 |
| 62.506 | 62.436 | 62.383 | 62.323 | 62.266 | MM100 |
Performances historiques ARGAN
| 5 jours | 1 mois | 1er janvier | 5 ans |
|---|---|---|---|
| +2.37 % | -1.63 % | -8.33 % | -43.67 % |
Court terme
Neutre
Moyen terme
Baissière
Long terme
Baissière
Portefeuille Trading
+322.00 % vs +68.67 % pour le CAC 40
Performance depuis le 28 mai 2008